A whistle, buzz, or rising vibration level raises a practical question: why is my turbocharger vibrating? Possible sources include imbalance, oil-film motion, contact, or something outside the rotating assembly. A single sound clip or spectrum rarely settles that question.
A waterfall plot adds operating context. It shows which frequencies follow shaft speed, which remain relatively steady, and which appear only under certain conditions. For test engineers and advanced rebuilders, those relationships help narrow an investigation without treating every spectral peak as a failed part.
How to Read Turbocharger Waterfall Plots
A frequency spectrum separates a measured signal into frequency components. A waterfall, also called a cascade plot, stacks successive spectra against shaft speed. Each slice represents a measurement interval during a controlled speed sweep or at a steady operating point.
The display typically shows:
- Frequency: how quickly a vibration or pressure fluctuation repeats.
- Shaft speed: the operating speed associated with each spectrum.
- Amplitude: the strength of each component, shown through peak height or color.
Some waterfall displays stack spectra against time instead. Check the axis labels before interpreting a waterfall diagram for a turbocharger.
On a frequency-versus-speed display, turbocharger vibration frequencies proportional to shaft speed trace sloping ridges. A component that stays at nearly the same frequency follows a constant-frequency path.
An order map expresses frequency relative to shaft rotation. A once-per-revolution component stays at order 1 as speed changes. Order maps make speed-related patterns easier to compare; frequency maps make fixed-frequency behavior easier to recognize.
Start With 1X, Harmonics, and Actual Turbo Speed
1X is the turbo shaft’s rotational frequency. Expressed in hertz, it is shaft revolutions per minute divided by 60. Engine RPM is a different reference: turbo speed does not maintain a fixed ratio to crankshaft speed.
Mass imbalance creates a rotating force at 1X. A strong synchronous response therefore makes imbalance a reasonable possibility. However, the measured response also depends on bearing support, damping, sensor position, and proximity to a rotor resonance.
A rise and fall in 1X amplitude during a sweep can reflect passage through a resonance. It does not necessarily mean the imbalance itself changed.
Harmonics occur at whole-number multiples such as 2X and 3X. They indicate repeating content beyond a simple once-per-revolution sinusoid. Distorted motion, contact, and nonlinear forces can generate harmonics, but no single harmonic uniquely identifies a fault.
A synchronous whistle may accompany rotor excitation, yet an audible tone is not automatically the shaft’s 1X frequency. Aerodynamic tones, engine orders, and structural resonances can complicate turbo noise frequency analysis.
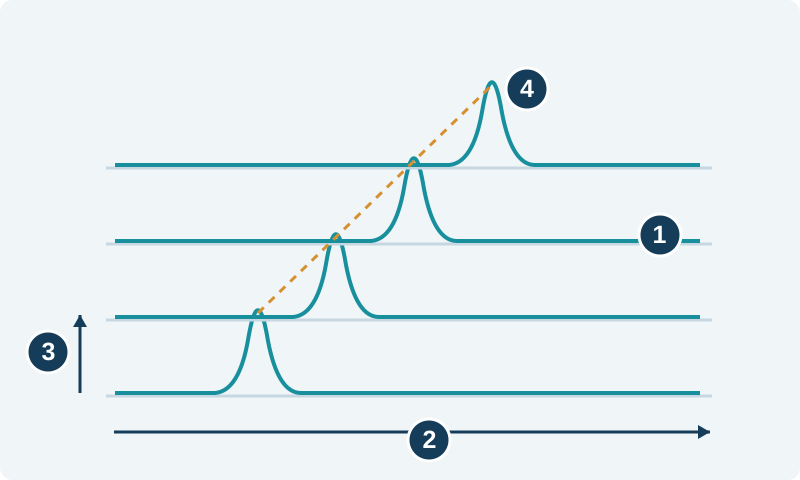
Each trace: one vibration spectrum at one speed.
Horizontal direction: vibration frequency.
Peak height: vibration amplitude.
Moving peak: an example of a speed-tracking 1X ridge.
Qualitative schematic, not measured test data or operating limits.
Reading Subsynchronous Motion From Oil Films
Subsynchronous vibration occurs below 1X. In oil-film bearings, pressure generated by the moving lubricant supports the shaft. Those fluid forces can also sustain a precessing motion: the shaft center travels around an orbit rather than remaining stationary.
A fully floating-ring bearing has an inner oil film between shaft and ring and an outer film between ring and housing. The ring rotates, so the two films experience different relative surface speeds. Their coupled behavior can produce distinct subsynchronous components.
Conventional oil whirl is often discussed as occurring somewhat below half shaft speed. That is a useful introductory reference, not a universal identification rule for turbochargers. Floating-ring behavior depends on ring speed, geometry, lubricant conditions, and rotor motion. Assigning every below-half-speed ridge to the outer film would be unjustified.
Oil whip describes a related instability in which vibration becomes tied to a rotor natural frequency over a range of increasing shaft speed. In a frequency map, a component may stop following speed proportionally and remain near that frequency.
Neither a low-order ridge nor a nearly constant tone proves an instability by itself. Repeatable behavior, shaft-motion measurements, and knowledge of the bearing system are needed to support that interpretation.
Why Combination Frequencies and Turbocharger Vibration Sidebands Appear
Oil-film forces do not always increase in simple proportion to shaft displacement. Moving farther from the bearing center changes the film geometry and its response. Intermittent contact introduces an even stronger change in behavior.
This makes the rotor-bearing system nonlinear. Different motions can interact instead of appearing only as independent peaks.
Imagine a once-per-revolution vibration whose strength rises and falls with a slower oil-film motion. The slow motion changes the envelope of the faster signal. This is amplitude modulation.
In the spectrum, that interaction can produce components above and below 1X. Their spacing from 1X corresponds to the slower modulation frequency: one lies at the sum of the two frequencies and another at their difference.
Periodic changes in the timing or phase of the faster vibration can also produce modulation sidebands. Stronger or more complicated interactions may generate additional combinations and families of sidebands around harmonics.
Two cautions matter:
- Simply adding independent vibrations does not automatically create new frequencies; modulation or nonlinear interaction is needed.
- Sidebands need not have equal measured amplitudes because the machine and measurement path respond differently at different frequencies.
Look for repeatable spacing that matches another measured component. Sidebands are evidence to investigate, not a direct measure of wear or proof of one particular defect.
Turbocharger Shaft Vibration vs Housing Vibration: What Sensors Measure
Sensor choice determines which part of the behavior you can observe.
| Measurement | Useful information | Main limitation |
|---|---|---|
| Eddy-current proximity probes | Shaft displacement relative to the probe mounting structure | Requires suitable access, target material, calibration, and mounting |
| Housing accelerometers | Structural vibration transmitted through the housing | Housing response is not the same as shaft displacement |
| Microphones | Airborne tones and broadband noise | Includes airflow, engine, exhaust, and environmental sound |
| Shaft-speed or phase reference | Actual turbo speed and a rotational timing reference | Requires a reliable signal from the turbo rotor |
Eddy-current proximity probes sense changes in distance to a conductive target without touching it. Two probes oriented at right angles can reconstruct an orbit at their measurement location.
That orbit does not reveal motion everywhere along the shaft. A compressor-end measurement cannot directly establish displacement inside both bearings. Target runout, material variation, and mounting movement can also influence the signal.
Accelerometers near the bearing housing help reveal transmitted vibration and possible contact-related activity. Microphones show which behavior becomes audible. Comparing synchronized channels helps connect shaft motion, housing vibration, and sound, although a shared frequency alone does not prove the transmission path.
Instrumenting a turbocharger for direct shaft measurement is specialized test work requiring suitable fixtures and controlled operation.
Sampling Basics That Prevent False Diagnoses
Digital acquisition records a signal at discrete intervals. The Nyquist frequency is half the sampling rate. Signal content above that limit can appear falsely at lower frequencies, a problem called aliasing.
An aliased high-frequency tone can resemble subsynchronous vibration. Once it has been sampled incorrectly, changing the plot scale or applying a later software filter cannot reliably restore the original information.
Plan acquisition around the highest frequency of interest, including harmonics and sidebands. The complete system needs an appropriate anti-alias filter before sampling, with room for the filter’s transition band. Setting the sampling rate barely above twice the desired maximum frequency leaves little practical margin.
Other settings matter too:
- Record duration: longer records improve separation of nearby frequencies when operation remains steady.
- Speed variation: rapid changes within a record smear speed-related peaks.
- Windowing: a suitable window reduces spectral leakage but affects peak shape and amplitude interpretation.
- Dynamic range: clipping can create artificial harmonics and other misleading content.
- Order tracking: processing referenced to shaft rotation helps preserve orders during changing speed.
Increasing the turbocharger vibration sampling rate alone does not separate closely spaced sidebands. That also requires enough observation time and suitable operating stability.
Patterns That Suggest Imbalance, Oil Whirl, or Wear
Use patterns to choose the next check. Avoid treating a spectrum as a parts-replacement instruction.
| Observed pattern | Possible interpretation | Useful follow-up |
|---|---|---|
| Dominant 1X ridge following turbo speed | Imbalance-related excitation, possibly amplified by resonance | Check phase behavior, rotor condition, and balance evidence |
| Subsynchronous ridge with repeatable onset | Oil-film motion or another nonlinear response | Review bearing design, lubricant conditions, and shaft orbits |
| Subsynchronous frequency becoming nearly fixed as speed rises | Possible oil whip or another resonance-related response | Compare with rotor dynamic evidence and other sensor channels |
| Sidebands spaced by a measured low-frequency component | Modulation or nonlinear coupling | Check whether spacing and onset track that component |
| New harmonics, broadband activity, or abrupt changes | Possible rubbing, looseness, damage, or changed operating conditions | Inspect for contact and installation problems |
| Higher vibration than a matched baseline | Changed rotor, bearing, installation, or measurement condition | Repeat under controlled conditions and inspect dimensions |
Wear has no universal spectral fingerprint. Increased clearance or damaged surfaces can change damping, motion, and contact behavior, but the outcome depends on the assembly.
Physical inspection remains essential. Measure clearances against the applicable specifications and inspect for scoring, wheel contact, contamination, and oil-supply problems. Do not convert an audio peak into a clearance estimate.
A practical workflow for turbo vibration analysis and inspection
Before comparing plots for diesel turbocharger vibration diagnosis, establish that the tests are comparable:
- Confirm turbo identity, bearing configuration, and actual shaft-speed reference.
- Record load, boost, oil temperature, and available oil-pressure information.
- Keep sensor positions, mounting, acquisition settings, and amplitude scales consistent.
- Save raw signals alongside processed plots.
- Compare controlled acceleration and deceleration where the test setup permits.
- Check intake and exhaust leaks, shields, brackets, and nearby vibration sources.
Use the same amplitude units and scaling between tests. Displacement, acceleration, and sound pressure emphasize different aspects of the response; their peak heights are not interchangeable.
If operation produces scraping, rapidly increasing vibration, or evidence of wheel contact, stop testing and inspect. Continuing a sweep through suspected contact can turn a diagnostic exercise into additional damage.
What Phone Recordings Can and Cannot Show
A phone recording can preserve when a noise starts, whether its pitch rises, and how it relates to throttle or load. That makes it useful supporting information for a shop.
It cannot reliably measure shaft displacement or establish bearing condition. Automatic gain control, noise suppression, compression, microphone response, and clipping can alter spectral content. A recording app’s displayed sample rate does not establish the usable bandwidth of the microphone and processing chain.
Without measured turbo speed, a rising whistle cannot confidently be labeled 1X. Keep recording position and app settings consistent for comparisons, but use calibrated measurements and inspection for diagnosis.
Common Questions
What does 1X mean in turbo vibration analysis?
1X means once per turbo shaft revolution. Its frequency follows turbo shaft speed, not engine crankshaft speed. A strong 1X component can support an imbalance diagnosis, but resonance, shaft geometry, and measurement errors can also affect it.
Is subsynchronous vibration always oil whirl?
No. Oil-film motion is one possible source, but rubbing, other nonlinear responses, unrelated machinery, and aliasing can also produce apparent components below 1X. Confirm shaft speed, measurement quality, and bearing design before assigning a cause.
Do modulation sidebands prove bearing wear?
No. Sidebands show that a signal is being modulated or that interacting motions are producing additional frequencies. Wear can change those interactions, but operating conditions, rubbing, and normal nonlinear bearing behavior can also contribute.
Can a phone recording diagnose turbo imbalance?
A phone can document when a sound occurs and whether its pitch changes. It usually cannot establish turbo imbalance because shaft speed, microphone response, signal processing, and recording bandwidth are uncertain. Use it as supporting evidence.
What sampling rate should a turbo vibration test use?
Choose the rate from the highest frequency you need to measure, including relevant harmonics and sidebands. Keep that frequency below half the sampling rate, allow room for the anti-alias filter, and verify the bandwidth of the complete measurement system.
Can balancing eliminate oil whirl?
Balancing reduces excitation from mass imbalance. Oil whirl involves the rotor and its oil-film bearings, so balancing alone may not eliminate it. Bearing geometry, clearances, lubricant conditions, and the complete rotor response also matter.
Does turbocharger vibration require replacement?
Not by itself. Use vibration patterns to guide further checks. Measure clearances against the applicable specifications and inspect for scoring, wheel contact, contamination, and oil-supply problems.
For parts support following turbo vibration analysis, contact LeadTurbo with your turbo part number, vehicle details, and symptoms for help identifying replacement turbochargers, CHRA assemblies, or service parts.